

Exploring the Quintessential Tango Question
Given the same OBP and Slugging, What's the Ideal Batting Average?

I love batting average as a metric, it does a great job describing the batter, and also has a 0.62 R² with wOBA, meaning it correlates very strongly with performance. Should it be the only thing that broadcasts show, definitely not. Should it be present, alongside BB%/OBP and SLG/ISO? Absolutely.
You can read my deep dive on the subject here:
The Sabermetric Case for Batting Average

I have an enormous amount of respect for Tom Tango, and am deeply grateful for the time he’s taken to review some of my work over the past decade.
The Quintessential Tango Question
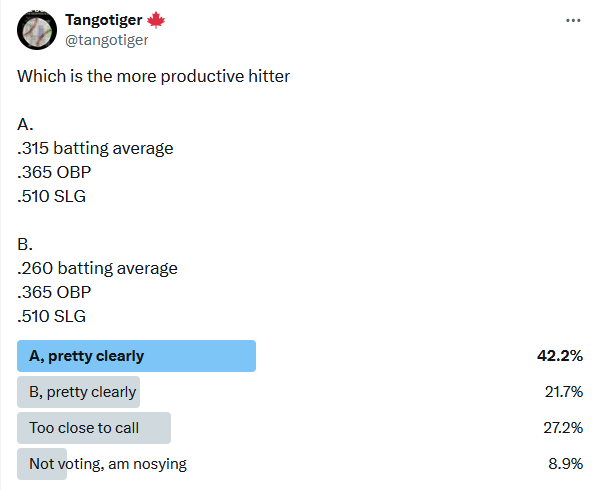
Every once in a while, Tom Tango posts this question on X, formerly known as Twitter:
https://x.com/tangotiger/status/1841854550887559358
Please read his corresponding article explaining why he concludes “too close to call” is the correct answer (I think it’s B as I’ll show today).
My Code - The Triple Slash Spreadsheet
You can find my code in the following repo, which includes a handy spreadsheet that does some math to convert a triple slash line into per PA numbers.
Repo: https://github.com/elibenporat/tango
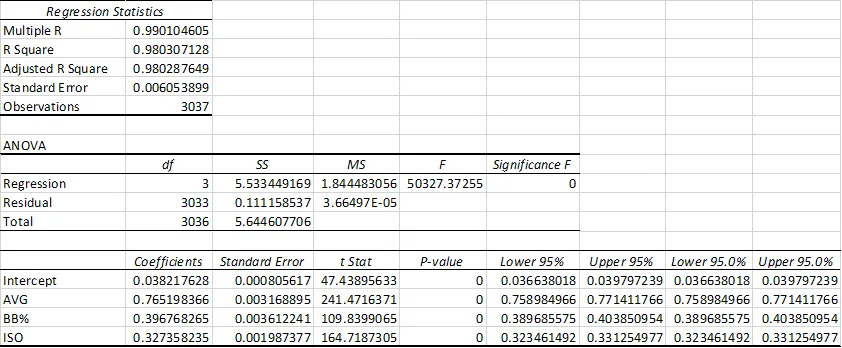
The Excel sheet will show you a result that confirms what Tom wrote in his article.
Let’s walk through step by step how to convert a triple slash line into per-PA BBs, and base hits. Here we’re assuming all events are either an out, walk or a hit. This of course isn’t strictly true, but is close enough that it shouldn’t matter.
If we do some basic math, we can estimate the BB/AB ratio using the following formula: BB/AB = (OBP-AVG)/(1- OBP). Once we know the BB/AB ratio, we can assume the number of plate appearances is AB + BB.
Thus BB/PA = (BB/AB) / (1+BB/AB).
We then need to distribute the extra base hits between doubles, triples and home runs, on a per at bat basis. Using FanGraphs data, I came up with a ratio of 0.56, 0.05 and 0.39 for doubles, triples and home runs.
That means that 0.56 * 1 + 0.05 * 2 + 0.39 * 3 = .183, so we can compute the breakdowns as follows, using ISO (SLG - AVG).
2B/AB = ISO * 0.56/1.83
3B/AB = ISO * 0.05/1.83
HR/AB = ISO * 0.39/1.83
To convert to per PA, we divide by (1+BB/AB). That will allow you to create this breakdown, which confirms what Tango was seeing, with values from the FanGraphs seasonal constants page.

The Simulation
So why in the world do I think the low batting average hitter is better than the high batting average hitter, given the same .365 OBP and .510 slugging? Doesn’t the spreadsheet definitively prove that I’m wrong?
If you read my article above, you’ll see why I think the lower batting average guy is better, but today, we’re going to explore this from a simulation standpoint. Before I walk you through the nitty gritty of the simulation and code, here’s what the simulation produced for Quint Mattingly, Quint Strawberry and all the other theoretical Quints.

We see a small, but clear trend where if we build a team of 9 identical batters, the team with the lower batting average will score more runs per 9 innings.
A neat thing about this simulation is we can show the relative importance of getting on base, vs just pure ISO. Note how given the same OPS (.875 in this example), the highest Runs/9 come from the higher BB% team, with the reverse being true for ISO.

This confirms what I discovered in my linked article at the top, where a point of BB% was more valuable than a point of ISO:
Explore the Results
I uploaded “players.csv” to the repo, which is the output of my simulation. Please feel free to explore, use and most importantly, look for errors and/or bugs. Note that the simulation will include some impossible scenarios such as batting averages greater than slugging percentages. You’ll want to filter those results out.
How the Simulation Works
We take the triple slash line and produce a set of probabilities for walk, single, double, triple, home run and out. You can find the step by step in the spreadsheet, and also in the following Rust code:
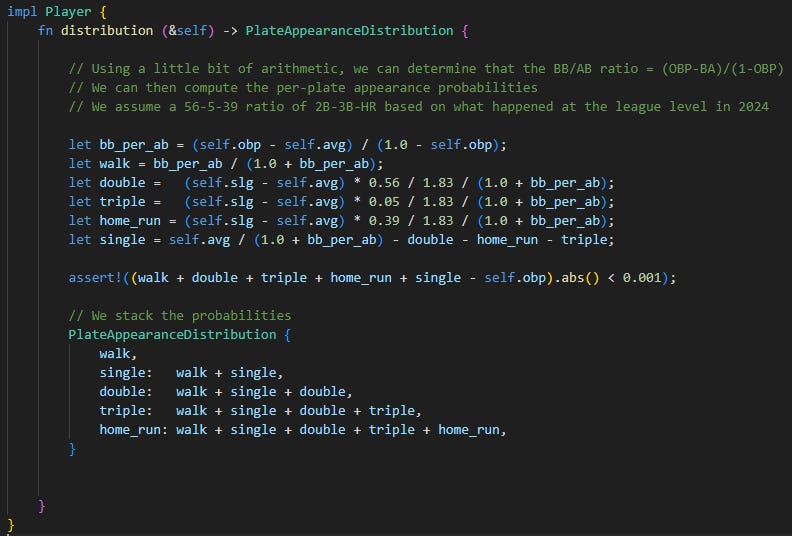
Each plate appearance is then simulated as a representation of that probability:

I’m skipping some of the nitty-gritty details, but basically it loops through PAs of the same exact batter until 3 outs are recorded, and logs the number of runs scored.
Then in beautiful succinct Rust fashion, we can run the simulation in parallel across all batters with these 3 lines:

Please look through my code, and let me know if you find any bugs or errors. If you’re Rust-curious and want some help getting set up to run it yourself, please DM me on X/Twitter and I’ll be happy to help.
Other Quint Breakdowns

If we hold slugging constant and break things down by OBP, we see a similar trend where a lower batting average is better, given the same OBP and SLG.

Interestingly, the trend is clearer with a lower BA/SLG ratio, lower batting average is clearly better, but once we start slugging around .560 or so, the trend disappears.
There are many permutations to this, so please download the data and explore, and most importantly, let me know if you find any errors.
Conclusion
The simulation clearly shows that for all permutations of OPS within the Quint range, a lower batting average is preferable, albeit slightly. This comes with the caveat that it’s based on a simulation of 9 identical batters, which obviously will never be the case. This does not mean that you want batters to have a lower batting average, rather, it surfaces the complex run-producing relationships between AVG, BB% and ISO.
In the poll question Tom Tango posed in your article he said, what is the most PRODUCTIVE HITTER? Being productive to me means scoring runs AND driving them in (RBI), so in essence on offense, to me that means 2 things: 1. bases moved vs. bases caught, 2. sequencing dependent upon your teammates efforts as well, hence the modern game is skewed because it's not as much of a team game. Its more about the select few individuals, those that hit homers, as the game is now homer dependent. 2024 vs. 1984: homers make up a greater portion of RBI and runs in 2024 (1 homer to every 3.7 RBI to 3.9 runs) than 1984 (1 homer to every 5.1 RBI to 5.5 runs) I do not see how you can convey this accurately by rate stats as there is too much variation in production (and unique production at that), given the same or similar rates (BA/OBP/SLG/OPS). An out is not necessarily a negative. A sac fly drives in a run from third or can move runners from 2nd to 3rd or 1st to second when deep enough. That is moving players one base even though you get out. Furthermore, this is similar to the question of how you construct an ideal line up? Also, certain base states have equivalencies, for example, a walk and a single are worth the same when bases are both empty. But a single will outdo a walk in most other cases due to moving teammates around. For example, a batter is on first with a walk. Next guy hits a single. The guy that walked moves to 3rd, so that is two bases moved for the guy that went 1st to third, and one base for the single, so the guy that hit the single gets 3 bases moved. As opposed to a guy on first with a walk already, next guy up gets a walk, 2 total bases moved for the guy that got the second walk.