


The Sabermetric Case for Batting Average
Will I Convince Tom Tango that BAPP is the path to replacing OPS?

I have an enormous amount of respect for Tom Tango, and am deeply grateful for the time he’s taken to review some of my work over the past decade.
There is, however, one aspect of baseball where I disagree with his perspective, specifically, the utility of displaying batting average as an important metric, both from a valuation standpoint as well as a descriptive standpoint.
Many moons ago, when the “moneyball” revolution began, the sabermetric community correctly pointed out that On Base Percentage (OBP) is a better metric than Batting Average (BA), implying that if we have OBP, we don’t need BA.
The modern refrain eschews more to the hue that if we have OBP and Slugging Percentage (SLG) than knowing the player’s BA is superfluous. This statement is mostly accurate, from a pure valuation standpoint, when presented in that manner. Indeed, if you know just a player’s OBP and SLG, you can explain almost all of a player’s wOBA for that season.
Let me also propose another statement, that is equally accurate:
If you know just a players BA, BB% (walk percentage) and ISO (isolate slugging percentage) you can explain almost all of a player’s wOBA.
So why should we prefer 3 metrics (BA+BB%+ISO=BAPP) to 2 (OBP+SLG=OPS)? Before we answer that question, let’s meander about for a bit.
The Data Used
2017-2023 inclusive, min 100 PAs, split by season, courtesy of the amazing FanGraphs; 3037 samples total.
OBP and the BA/OBP Ratio
If all you knew was that a batter had a .400 OBP, would knowing their batting average help predict their wOBA? To test this, let’s first look at OBP/wOBA and BA/wOBA.
OBP & wOBA | R2 = 0.80043
BA & wOBA | R2 = 0.624761
Clearly, if we were only allowed to choose one metric, we would always choose OBP over BA. This somewhat glosses over the fact that over 62.5% of the variance in a batter’s wOBA for the season can be explained by batting average. To say that batting average is “meaningless” would not be a correct statement. Saying that OBP is preferred to BA if we must only use one metric or the other to measure value, would be a correct statement. Personally, I don’t think it’s appropriate to belittle a metric that has such a strong correlation to production.
OBP & wOBA vs BA+OBP & wOBA
What if we not only knew a player’s OBP, but we also knew roughly how much of their OBP was driven by batting average, approximated by the BA/OBP ratio? Would that improve our understanding of the batter’s value, in addition to the descriptive benefit of telling us how the batter is getting to their production (hit tool vs patience/eye)?
Excel spits out the following formula: -0.0575 + 0.0846 BA/OBP + 0.96 OBP with an R2 of 0.821 (an improvement on just OBP).

Intuitively, this makes sense, since the linear weights value of a single is roughly .185 runs more than a walk. This also means that we’d prefer a .300 BA/.400 OBP hitter to a .200 BA/.400OBP hitter, all else being equal (i.e. equivalent ISOs).
Let’s repeat this exercise with BA and SLG.
SLG & wOBA | R2 =0.8615
We see again, that if we had to choose between just BA and just SLG, we would always choose SLG. Now, the question becomes, is it better or worse to have a higher BA/SLG ratio? Does knowing a player’s batting average if we already know their slugging, does that improve our wOBA prediction?
SLG + BA/SLG & wOBA | R2 = 0.8995

Again we see that a higher proportion of SLG being made up of BA is (a) good and (b) statistically significant. It’s also nice that the intercept came out to basically 0, giving us almost pristine coefficients.
To summarize our findings above:
Having more of your OBP be comprised of batting average is a good thing
Having more of your SLG be comprised of batting average is a good thing
The Triple Slash Line Confusion
What if we take all 3 ingredients of the triple slash and throw them into a regression soup, what kind of result would that give us?
We get a result that suggests that batters are better off with a lower batting average, which directly contradicts what we found in the previous two sections. How can this possibly make sense? How can having a higher BA/OBP and a higher BA/SLG be good, but when we have both OBP and SLG, a lower batting average is better?
Turns out, it’s actually rather simple. OBP and SLG are each heavily correlated with batting average, so we are essentially feeding the soup batting average 3 times. Given that the soup “knows” the batting average, a higher BB% and ISO% is preferred. Essentially, the AVG metric in this context, should be looked at as a combination of BB% (not precisely, but will correlate to OBP-BA) and ISO (SLG-AVG). The lower your BA compared to your OBP and SLG, the higher your BB% and ISO are.
Here’s a good way to understand it. To simplify we’ll use isolated patience (OBP-BA) as a proxy for BB%.
Example:
Let’s say player A has a .300/.400/.500 slash line and we wanted to compare that to player B with a .200/.400/.500 slash line. Which player is better? OPS will tell you they are the same, but the above formula would suggest that the .200 hitter is actually better, with a .3894 wOBA compared to .3859 wOBA given the formula above.
This illustrates the obvious truth that you can have a poor batting average, and make up for it with Patience (BB%) and Power (ISO). One should not conflate the ability to overcome a poor batting average with the notion that a poor batting average is not undesirable.
So what’s going on? Is the .200/.400/.500 hitter actually better than the .300/.400/.500 hitter? Yes. Absolutely. This is why:
The .200 hitter is essentially “trading” a loss of 100 points of batting average, for a gain of 100 points of Patience and 100 points of Power. All in all, this is a slightly positive trade for the batter. They have a BAPP of roughly .200/.200/.300 compared to their counterpart with a .300/.100/.200; when presented this way, the comparison is very clear.
In fact, the tradeoff suggests that a point of batting average is worth almost twice as much as a point of Patience, or a point of Power, an assertion that we’ll support in the next section:
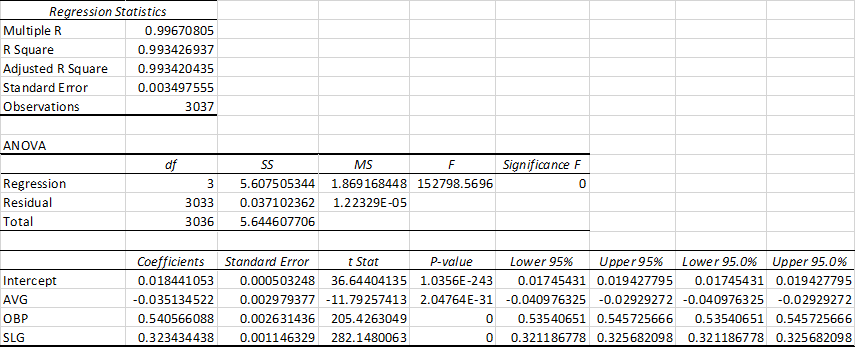
BA + BB% + ISO% & wOBA

Indeed, a point of batting average is worth roughly the combined value of a point of BB% and a point of ISO%. These are of course on different scales, so it’s not strictly apples to apples, but it lines up with our previous explanation. Not only is our correlation with wOBA near perfect, all 3 independent variables are statistically significant with p values approaching zero. I encourage others to reproduce, and perhaps put everything on the same scale.
BAPP = Batting Average / Patience (BB%) / Power (ISO)
I wrote about it here:
BAPP - A Better Triple Slash Line
There are three distinct components that make a batter successful, (a) hitting for average, (b) hitting for power and (c) getting on base by other means. I explored the relative value of each, within a team context, in this article: Traditionally, these 3 components have been represented with the triple slash line of AVG/OBP/SLG, or batting average, on b…
BAPP vs OPS & wOBA
OPS & wOBA clock in at a sweet .983 R2
BAPP & wOBA clock in at “only” 0.9 R2.
So why would I recommend this over OPS? We’ll get to that in a second, but first, we’ll adjust BAPP to reflect the fact that Batting Average isn’t being weighted properly. It should in fact be twice as important as the other two ingredients. Let’s create BAPP2 which is simply 2*BA + BB% + ISO%.
Voila, an R2 of 0.98, nearly identical to OPS. Emphasizing Batting Average compared to walks and isolated slugging gave us a much more accurate shorthand for wOBA.
BAPP Predictive Value

All 3 metrics predicted next season wOBA fairly well, with BAPP coming in at 0.185 R2, compared to .173 for OPS and .169 for wOBA itself. I wouldn’t read too much into the differences. Taking a different sample could change the ordinal rankings.
Here’s the Excel spit-out for the 3 components:

Summarizing the Sabermetric Case for Batting Average
Batting average on its own has a 0.62 R2 with wOBA.
Batting average is possibly much more important than BB% and ISO%, but all are significant no matter how you slice it, including for predicting next season wOBA
All things being equal, you want a higher proportion of your OBP and your SLG to come from batting average
The Qualitative Case for Batting Average and BAPP
When we talk about players, especially prospects, we talk about their distinct abilities to hit for average, hit for power and have a good eye at the plate. These are 3 distinct skills which map very closely to BA/BB/ISO (BAPP). BAPP does a great job of describing what kind of hitter a batter is. Freddie Freeman is great because of his batting average, patience and power, sporting a BAPP of .331/.099/.235. This paints the clear picture that he’s great in all aspects of hitting. Schwarber’s BAPP line of .197/.175/.277 (.649 BAPP) tells me that he’s more than making up for his poor .197 BA by supplying a lot of walks and a lot of power. BAPP2 would tell us to penalize him more for the poor batting average, if our goal were to improve our mapping to wOBA.
It allows simple metrics to map to tools. In this sense, it is highly descriptive of the batter. These metrics are all easily available on FanGraphs. If we want a metric which just gives us the most accurate valuation of the player’s offensive output, wOBA or wRC+ or DRC+ would be the way to go. If we want metrics which describe the batter, and map to all 3 distinct tools, BAPP is the way to go.
BAPP as a replacement for OPS
One of BAPP’s best features is that an average player will have roughly a .500 BAPP. Metrics that map to tools are the most powerful form of narrative, especially if they are easily understood. BB% and ISO are a little more obscure than OBP and SLG, but I believe that the average fan can buy into BAPP.
Should We Care That They Have Different Denominators?
Maybe.
Conclusion
Batting average is an important metric that does a great job describing the batter, and is an integral piece in estimating the value a batter produces. I really, truly believe BAPP is the way forward, but need the community to rally behind it and make it a thing, as I am but a small voice.
FWIW, Tango's "standard wOBA" formula:
wOBA = 0.9 * 1B + 1.25 * 2B + 1.6 * 3B + 2.0 * HR + 0.7 * (BB+HBP)
... could be broken down as
wOBA =0.9 * H + (0.35 * 2B + 0.7 * 3B + 1.1 * HR) + 0.7 * (BB+HBP)
which is kind of close to
0.9*H + 0.35 * (TB-H) + .7 * (BB+HBP)
So if we divide by .35, ignore the HBP, and forget about the denominator mismatch, this could sort of be mapped to
2.6 * AVG + 2 * BB% + ISO
Maybe we just round up the 2.6 to 3 and call it...
BAPP321 = 3*AVG + 2*BB% + ISO
This one has a RSQ of 0.968 with wOBA (same dataset as you used here). So not quite as good as BAPP2. OTOH, the algebraic relationship between BAPP321 and wOBA is a little more direct than that between BAPP or BAPP2 and wOBA.
You can also see my contributions from two years ago, and you can see obvious parallels with Eli's more rigorous approach:
http://tangotiger.com/index.php/site/article/lies-damned-lies-and-batting-average
In other words: start with what you think is CENTRAL for a batter, then create the other metrics needed to support that.
Eli thinks it's getting hits. I think it's getting on base.