I’ve been on a mission to create a formulaic Stuff+ for all pitch types, with the goal of deepening our understanding of what makes a pitch great. I am somewhat far away from my research goals, but I’m making slow, incremental progress. Here was my first iteration, which I dubbed Fastball+ at the time:
That formula used the more easily accessible x0 and z0 variables to create a Net IVB, which worked reasonably well. Today, we’ll hopefully improve on that, while still keeping an important constraint: The calculations must be possible to do in Excel. Excel has Visual Basic, so technically you can do anything in Excel, but you know what I mean. Today, we’re going to push the concept further, adding a little more complexity, in exchange for (hopefully) greater precision.
Maximum Explainability + Good Performance
My specific goal for this project is creating a model that explains why it thinks a pitch is good or bad. Having the “best” model is categorically not an objective, though we do need to create something very good, in order to have any utility. If you’re looking for maximum precision, I’d look to one of the many excellent public stuff models out there.
I intend to use these in my writeups, and I’d much rather tell you why a pitcher has a great fastball, rather than give you a theoretically more precise number, but not be able to pinpoint what it is that’s making it great. Today, we’re going to cover 4-Seam fastballs, future articles will delve into each different pitch type, with the same goals.
SMOKE Run Values
Going forward, all these formulae will be under the moniker SMOKE, which stands for Stuff Model: Open; Knowledge Enhancing. Who doens’t love a pitcher who throws absolute SMOKE? I’ve been thinking about which version of a pitch grade to use (run values, 100 scale or 20-80 scale) and I think I prefer the traditional scouting scale, a la Pitching Bot, however, this post is rather long, and somewhat technical, so I’m going to stick with run values for now, and convert them to the 20-80 scale at a later date.
Resources
Dr. Alan Nathan’s spin efficiency template:
http://baseball.physics.illinois.edu/trackman/SpinAxis.pdf
http://baseball.physics.illinois.edu/trackman/MovementSpinEfficiencyTemplate-v2.xlsx
Josh Hejka’s (https://twitter.com/hedgertronic) gist in Python (above links are also in the gist). Thank you Josh for sharing this!
https://gist.github.com/hedgertronic/92eb84500ace3efb83007aa6a9f65ccb
You’ll need the above to compute x_release, z_release, time_of_flight, IVB and estimated spin efficiency, in order to fully reproduce, and/or compute yourself. All of those are in Dr. Nathan’s spreadsheet, should you want to compute SMOKE in Excel.
Expected IVB & HB
One of the big things that stuff models taught us, revolves around how important release characteristics are to value a pitch. This is because the arm angle of the pitcher sets the expectation for how much ride/depth (IVB) and run/cut (HB) the pitch gets. Today, we’re going to propose a linear method for estimating expected IVB and HB, and the subsequent Net values, assuming the pitch is a 4-Seam Fastball.
What information does the batter use in order to guess how much the ball will move?
I found 4 elements to be predictive of IVB and HB using a simple mutiple linear regression. The first 3 are release height (zr), release side (xr) and pitcher height, which when combined, can be used to create a very good approximation of a pitcher’s arm angle. The 4th, release extension, is heavily correlated with the zr and xr, but is important information to the batter as well.
You’ll need pitcher height, which isn’t always the easiest to collect. Michael Rosen @bymichaelrosen maintains a spreadsheet you can use:
https://docs.google.com/spreadsheets/d/1thIC-gyTXGf4n1o_LfQdEh_y2zXSyKWdkN0eDshLWUw/edit?gid=0#gid=0
The regression model spit out the following formulae:
xIVB = 17.16 - abs(x_release) * 0.85 + z_release * 2.53 - pitcher_height_in * .25 + pitch_extension * .665
xHB = 9.58 + abs(x_release) * 1.02 - z_release * 2.57 + pitcher_height_in * 1.02 - pitch_extension * 1.88
Note that, generally speaking, anything that increases HB will reduce IVB, and vice versa. These elements are all interconnected.
I normalize all breaks for velocity, with the following simple formulae:
IVB/F = IVB / time_of_flight * 0.4
HB/F = HB / time_of_flight * 0.4 (*IMPORTANT* sign is flipped for RHP)
This ensures that we aren’t giving a pitcher with a very slow fastball a bonus for more IVB, nor punishing a guy like Félix Bautista for having monster velo. The 0.4 seconds is roughly the time an average fastball takes, so it will give you numbers that you are used to seeing.
Net IVB = IVB/F - xIVB
Net HB = HB/F - xHB
xHB is predicting what the batter expects in terms of arm-side run, and since we’ve already flipped the sign for RHP, we’re now comparing apples to apples.
Net IVB Stuff
I created a rough measure of how much a pitch outperforms its context. It’s a 2 stage calculation, first it takes the exit velocity and launch angle and converts that into an average run value (not a model, just a simple average), then it compares the observed run value in that location & count for that pitch type, and checks if it was better or worse.
It’s not a very sophisticated methodology, but when we’re talking about thousands of pitches in a macro context, it works really well. Positive numbers are good, negative numbers are bad.
We see a very linear trend starting from around -2 Net IVB all the way to +6 Net IVB, basically flat below that, and a weird, small sample bump below -8. What’s going on there? It turns out that if the fastball is more like a hard cutter, Net IVB doesn’t really matter anymore.
Here I’m looking at Statcast pitch types FF and FC, with a minimim velo of 91, and classifying anything less or equal to 40% estimated spin efficiency as a hard cutter. This isn’t a thorough and exhaustive pitch classification exercise, but our goal today is not to arrive at perfection, it’s to maximize explainability.
We can estimate the value of Net IVB using this formula:
Net IVB Value =
IF spin_efficiency <= 0.4 THEN 0 // Hard cutters don’t care about Net IVB
ELSEIF net_ivb < -6 THEN -0.2 // Account for the weird blip!
ELSE -0.07 + 0.22 * net_ivb + 0.012 * net_ivb²
This should provide a rough estimate of how much value, in terms of runs, a pitcher is generating with how much ride they are generating compared to what the batter expects.
Net HB Stuff
4-Seam Fastballs don’t typically rely on horizontal break (or Net HB) except at the extremes:
As we approach 7-8” of either unexcepted cut or unexpected run, the pitch will generate surplus value. We can approximate this value with the following function:
NET HB Value = -0.08 - 0.0015 * net_hb + 0.0055 * net_hb²
The vast majority of pitchers will be very close to zero on this, but a select few, such as Justin Steele, will generate a lot of their fastball value from this.
Velocity Stuff
Velocity matters a lot. That being said, as we’ll see later, it’s possible we’re slightly over-valuing velocity compared to more sophisticated models.
We can approximate the value using the following function:
Velo Value: 57.95 - 1.35 * velo + 0.0078 * velo²
This will put a 90 mph fastball at -0.37, a 95 mph fasball at +0.1 and a 100 mph fastball at +0.95. As the function is somewhat exponential, we get +1.4 for a 102 mph fastball. Is that correct? I’m really not sure. If you are implementing this yourself, you may want to max out this function at 100 mph.
Pitch Extension
It’s a little bumpy, but there’s a definite linear trend with respect to extension. We can approximate the value of extension with the following formula:
Extension Value = -1.53 + 0.24 * release_extension
SMOKE Value
A pitcher’s four seam SMOKE value is simply Net IVB + Net HB + Velo + Extension. There are likely other elements to include, but “perfect is the enemy of good” so for now, I’m going to put any more upgrades to this formula and move on to sliders and curveballs.
The advantage of this setup is that we can quantify where a pitcher is generating their value. Tyler Mahle’s 2023 four seam fastball was great as he got a ton of Net IVB, but was below average in other components, meaning if he loses an inch or two of ride, his fastball quality will collapse. deGrom, Perez, Glasnow, Strider and Cole have a great combo of Net IVB, Velo and extension which make their fastballs extremely potent. Shintaro Fujinami is basically just velocity.
Looking For Co-Linearities
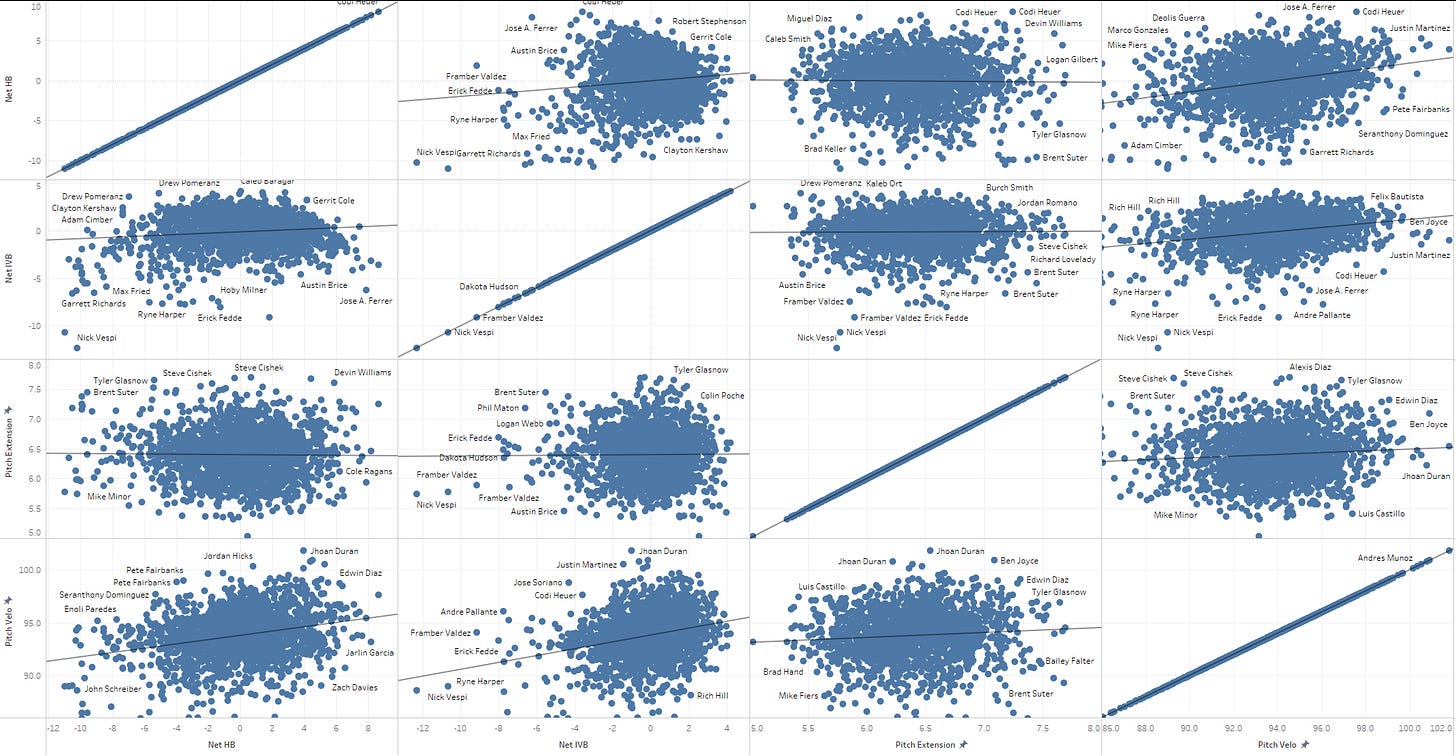
We’re asserting that we have 4 distinct components, but it would be prudent to check how these measures relate to each other. So let’s look at individual pitcher seasons and see if any one component links to any other:
Starting with Net HB, it has a slight relationship with Velo, which we’d expect, given that more velo => more drag => more movement. Net IVB is essentially the same story, and extension had no relationship to any of the other 3 variables. This would suggest that we should perhaps velocity adjust for Net IVB and Net HB, as we may be double counting its effect somewhat. We’ll save such cleanups for a future iteration, or for a fellow researcher, who wants to push this methodology further.
Validating the Model
I was curious if SMOKE grades worked well, so I downloaded the 2023 StuffPro grades from Baseball Prospectus, as well as the Stuff+ numbers from FanGraphs and mapped SPs with at least 200 FF thrown, and RPs with at least 100 FF thrown. Keep in mind that I built the SMOKE formula using the charts above, with no intent to map to StuffPro or Stuff+.
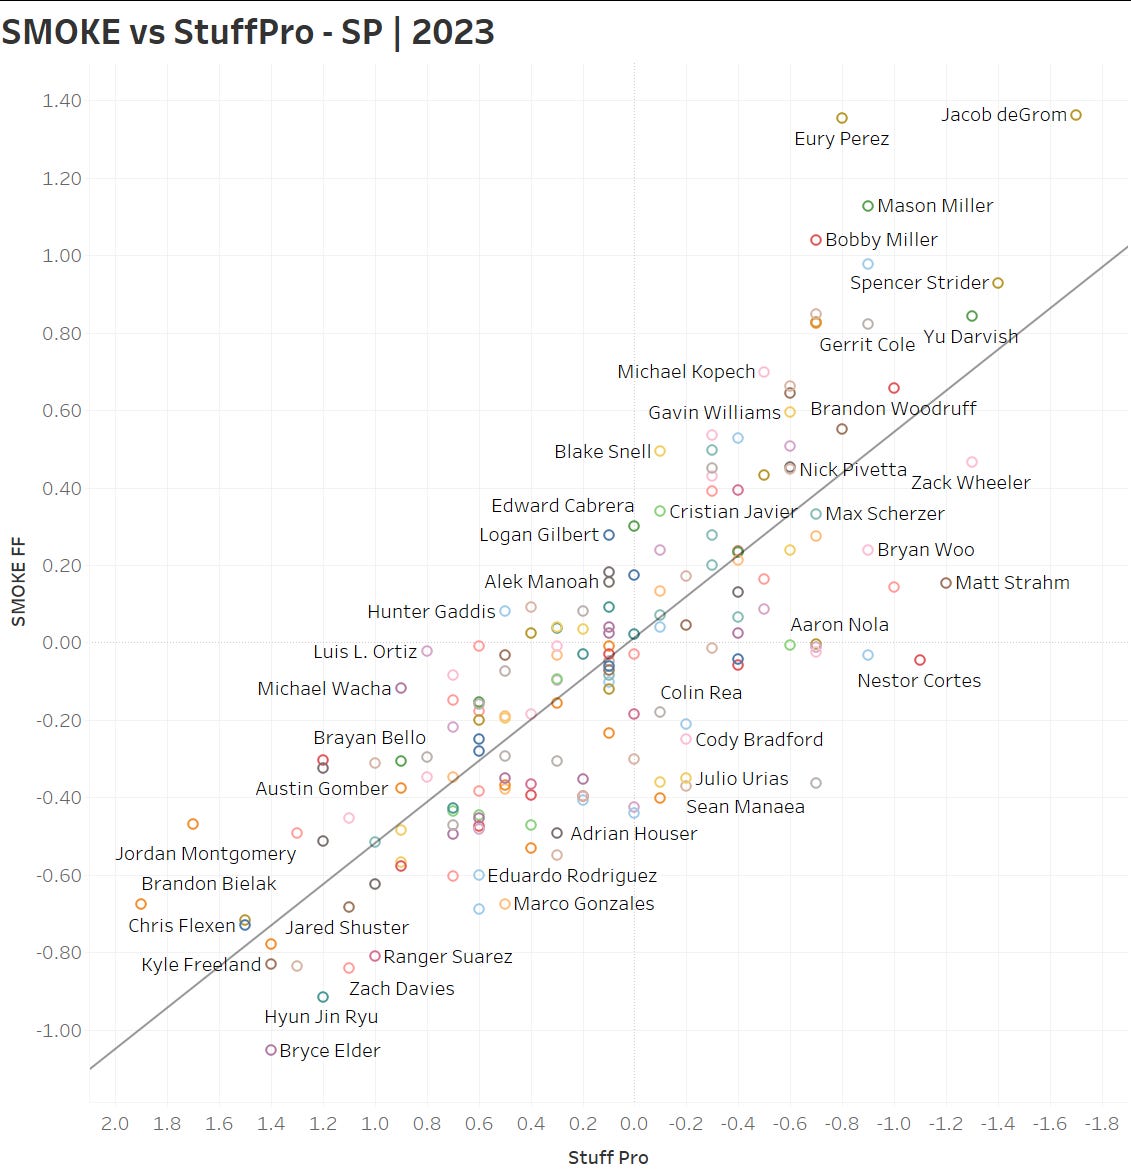
Let’s start with StuffPro:
We get an R² of 0.64, which is quite impressive in my opinion. Using just math, we can follow pretty closely to a very sophisticated model. There are a few interesting differences.
First, StuffPro appears to have twice the variance, such that a +1 SMOKE will be roughly a -2 StuffPro. I want to be very clear, this is NOT a critique of StuffPro, I’m merely highlighting a difference. Further, I’d lean towards the numbers that StuffPro produces as it is a far more robust methodology, with a lot more reputational risk riding on its shoulders.
StuffPro can capture potentially exponential interaction effects, whereas SMOKE does not (yet) look to capture interactions. Our primary goal is explainability, so I’ll need a way to crystallize interactions in order to properly quantify it. This may partially explain the variance difference, but the more likely explanation is that I need to fix something.
Second, StuffPro has more flexibility in modelling guys with unusual profiles, such as Nestor Cortes and Matt Strahm. When I was building out the formula, I did notice that extremely low xIVB did lead to better results (aka the VAA darlings), however, I chose not to include that in this iteration, as the sample sizes were very small. Perhaps for version 3!
Third, SMOKE appears to value velocity more than StuffPro, relatively speaking, we can see that more clearly when we look at RPs (min 100 pitches). This might also be due to the aforementioned double-counting due to velocity helping with Net IVB and Net HB. I’d love to fix all these little details, but I had to stop somewhere, or I’d never publish.
Here the R² dips to 0.5, with the big outliers being Ben Joyce and Nater Pearson, as well as Sam Moll, Tim Hill and Hoby Milner. Both models agree that Félix Bautista’s fastball was the best, and that Suarez’ is basically the worst.
If you ask me which model is more likely to give you a more precise valuation, I’ll point you to StuffPro or Stuff+, as those are built for that purpose.
Let’s see how it compares to Stuff+:
Holy! That’s a robust R² of 0.815, with the biggest outlier being Eury Perez, which is fascinating, since I’m essentially giving him a Net IVB bonus for being tall, whereas, to my knowledge, Stuff+ doesn’t use pitcher height (StuffPro does) which means it has no idea that Eury Perez is super tall and that his release height means something different. For whatever reason, SMOKE is convinced Eury has an almost deGromian fastball, whereas the Stuff models don’t. SMOKE is probably wrong.
RPs come in at an R² of 0.58, which is still a strong correlation, with the same outliers of Tim Hill and Hoby Milner. Fixing those outliers may or may not be a valubale improvement to this methodology
Concluding Thoughts
I was blown away when I saw how close these results were to StuffPro and Stuff+, and it gave me the confidence to say to myself that this version of the model is good enough to publish. Please share this, as I think it’s an important step in deepening our understanding of what makes a 4-seam fastball great.


