

Pitch Movement Synergy
A Simple Way to Analyze Pitch Tunnels

I’d like to propose what I consider to be an important simplification to pitch tunnels, which builds on prior research on the subject. In fact, I wouldn’t call it pitch tunnels, per se, rather, it’s a concept I’ve dubbed Pitch Movement Synergy.
Years ago, I came across The Psychology of Baseball by Mike Stadler. In it, he discusses research which indicates that hitters are (mostly) unable to calculate the velocity of the pitch, rather, they rely on timing, as well as knowledge of the pitcher, to make swing timing decisions. He shares two studies, one where hitters were given pitches that were anywhere in the range of 70 to 87 mph, and one where they were given either a 70 mph pitch or an 85 mph pitch. The performance in the second version was four times better than the first.
The conclusion is that batters can’t reliably estimate the distance the pitch is towards them, within the time frame of making a swing decision, at least not with the accuracy required to hit a baseball. The entire book is chock-full of interesting research that is still relevant today, I highly recommend giving it a read.
The proposed framework today will leverage this theory and propose the following simple, yet elegant framework:
The Pitch Movement Synergy Framework:
Quantify absolute vertical movement and horizontal movement in terms of time, not distance.
My assumption is that batters look at how pitches move over time to optimize swing decisions. This is similar in spirit to previous work on BaseballProspectus, which measured the visual angle at various points. In the previous work, they measured the physical separation between pitch pairs, including the release point, here I focus exclusively on movement, forcing, in essence, a common release point for every pitch; I find that this helps visualize movement synergy in a manner that is easier to consume. Additionally, I look at a pitcher’s pitches holistically, over time (months, years), rather than comparing distinct pitches. I make no assertions as to the scientific benefit of this approach in terms of quantifying potential performance impacts; however, I suggest that this framework is easier to consume and operationalize, and is a large impetus towards breaking apart the horizontal and vertical components.
The longer the pitches maintain synergy, the better (for the pitcher), as batters will use all available information to them. This is rather easy to compute, as the data include all the pieces you need (velocity, acceleration, and time) to calculate movement over time. I will show some visuals to demonstrate this. I propose to call the early part of the flight path as the information zone, up until some decision point. In fact, we don’t even need to specify the exact end of this zone, as it will be different for every batter and pitcher pair. Batters with more bat speed, or shorter swings, can delay their decisions, extending the decision point. The later, or less confident a batter can be about a pitch, the worse their swing decisions will be.
Pitchers should minimize movement deviations (as measured in distance over time, horizontally and vertically) between their pitches for as long as possible, while maximizing the absolute movement difference at home plate.
Here I make a very important distinction from the excellent work by Rendon, Emery, Sugar and Alexander. They make the case that the entire pitch path should be utilized to quantify pitch tunnels. While this may back into minimization of vertical and horizontal movement deviation, it also punishes pitchers who have above average deviation later in the pitch path (see deGrom, Jacob later in this article). Further, as noted by Long, Pavlidis and Alonso in the aforementioned piece, research indicates that batters cannot use the visual information from the last 1/3 of the flight of the ball. Mike Stadler had similar research in his book as well. Including anything outside of the information zone is counterproductive.
I also disagree with the speed separation recommendation as it pertains to synergy and/or tunneling. Again, this may back into movement minimization within the information zone, however, it is not an end goal in and of itself, from a synergy perspective. I would suggest that if a pitcher maintains excellent pitch movement synergy, as measured with time, within the information zone, the velocity separation is a separate optimization. In other words, I don’t believe that velocity separation is a factor in and of itself with respect to synergy and or tunneling.
In many ways, I may disagree with the work on ProspectsLive. I want to re-iterate that I think it is a fantastic piece, and worthy of a SABR award; please read all disagreements within the lens of constructive feedback.
The actual path of the ball isn’t the key, what matters most is movement horizontally and vertically.
The theory is that batters deduce pitch types primarily from movement in these 2 dimensions (specifically not in the direction towards them). This would directly imply that visualizations or analyses that rely on 3 spatial dimensions might be counter productive.
There may be other elements that aid in deception, synergy, and or tunneling, such as having consistent arm speed (or randomizing arm speed), randomizing release points (or are consistent release points better?), hiding the ball, mirroring spin, etc. These are all intriguing avenues to explore and hopefully someone can find an elegant way to quantify those elements, or has already.
A Few Visuals
Let’s show this in the form of pictures. Let’s begin with the best pitcher on the planet, Jacob deGrom:

Data here start at 50 feet from home plate, which means the time presented is not perfectly precise and the slower pitch should be shifted a tiny bit compared to the others. As mentioned above, we’re not looking for a precise decision or tunnel point, rather, we want to see how pitches move in comparison to a pitcher’s four seam fastball, through the information zone. Note that the reference lines indicated at the 0.20 second mark is provided as a guidepost only and is not intended to communicate a cutoff.
The first chart shows deviation of movement on the horizontal plane over time. Note how long the fastball and slider have nearly identical horizontal movement, but have an astonishing amount of horizontal separation once they begin to diverge. This gives the hitter minimal information from the horizontal plane, and they are forced to contend with two pitches that move the same initially, but diverge drastically thereafter. This would be a canonical example of “late movement”.
The second chart looks at the pitches in terms of absolute vertical movement (i.e. including gravity). Hitters don’t compute magnus forces or seam shifted wakes, they simply look at how a ball moves in comparison to all the other balls they’ve seen in general, and from the specific pitcher. We see deGrom has a good tunnel on the vertical plane, but not a perfect one. Stadler noted that spatial intelligence was linked to pitchers being able to locate on the vertical plane. We can perhaps assume that calculating movement on the horizontal plane is a distinct ability from calculating on the vertical plane. Batters who struggle with discerning vertical movement differences, may excel on the horizontal plane, or vice versa. In the case of deGrom, batters who can’t reliably glean information from the vertical plane will be hopeless against him, from a movement synergy perspective.
This approach may be useful to assess a batter’s ability to compute on the horizontal and vertical planes and may be useful in the evaluation of prospects, with proper data.
Matt Brash
Rendon, Emery et al. brought up the excellent example of Matt Brash. Here’s what the data look like with Matt Brash:
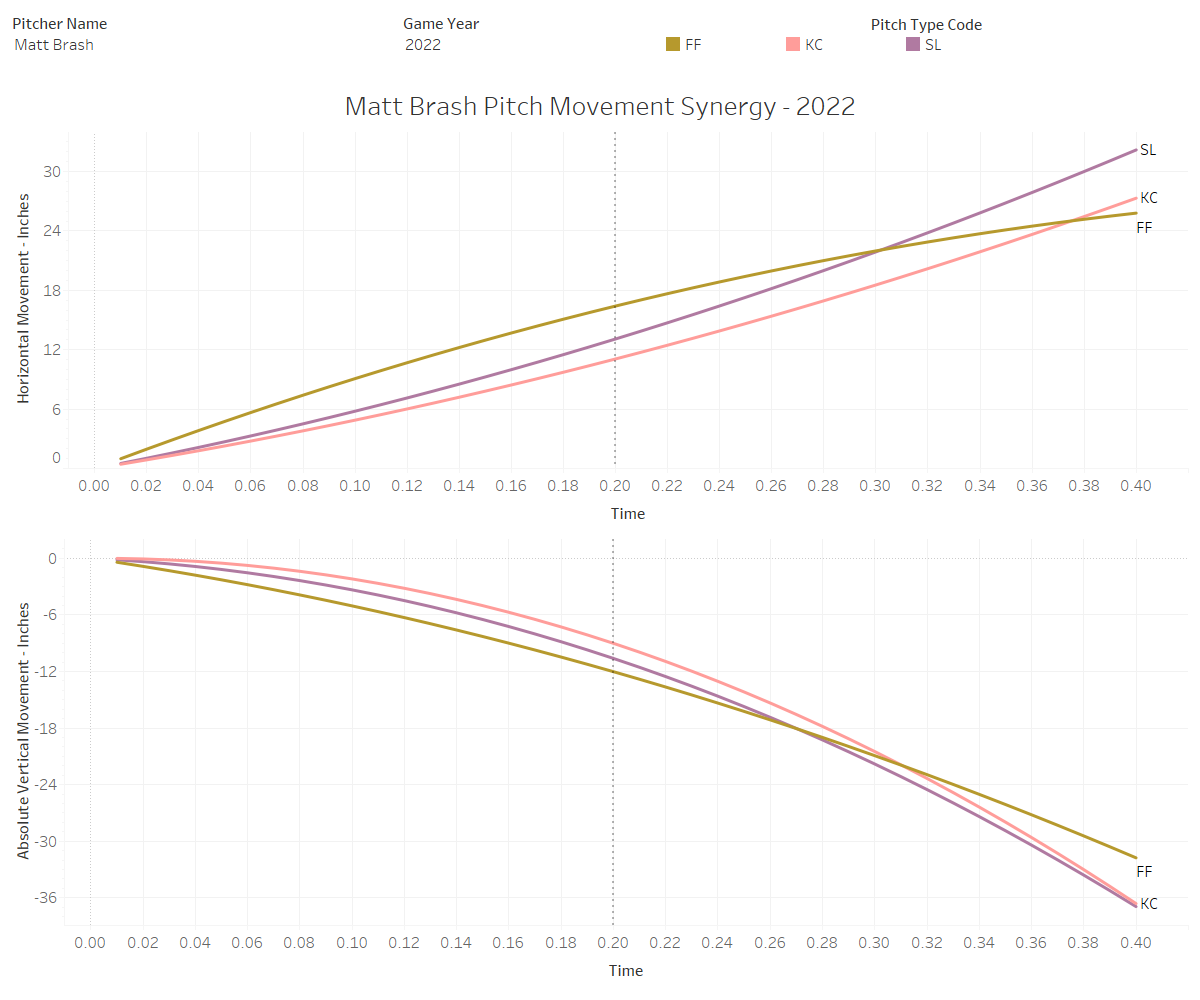
I concur with their conclusion that Brash has very poor movement synergy, however, rather than recommending adding another pitch to his arsenal (given that he already struggles with command), I believe he should focus on getting either the slider or the curve to mirror his fastball on the horizontal plane. Even a short window of synergy could make his stuff play up to absurd levels. The author hopes that he can help out a fellow Canadian.
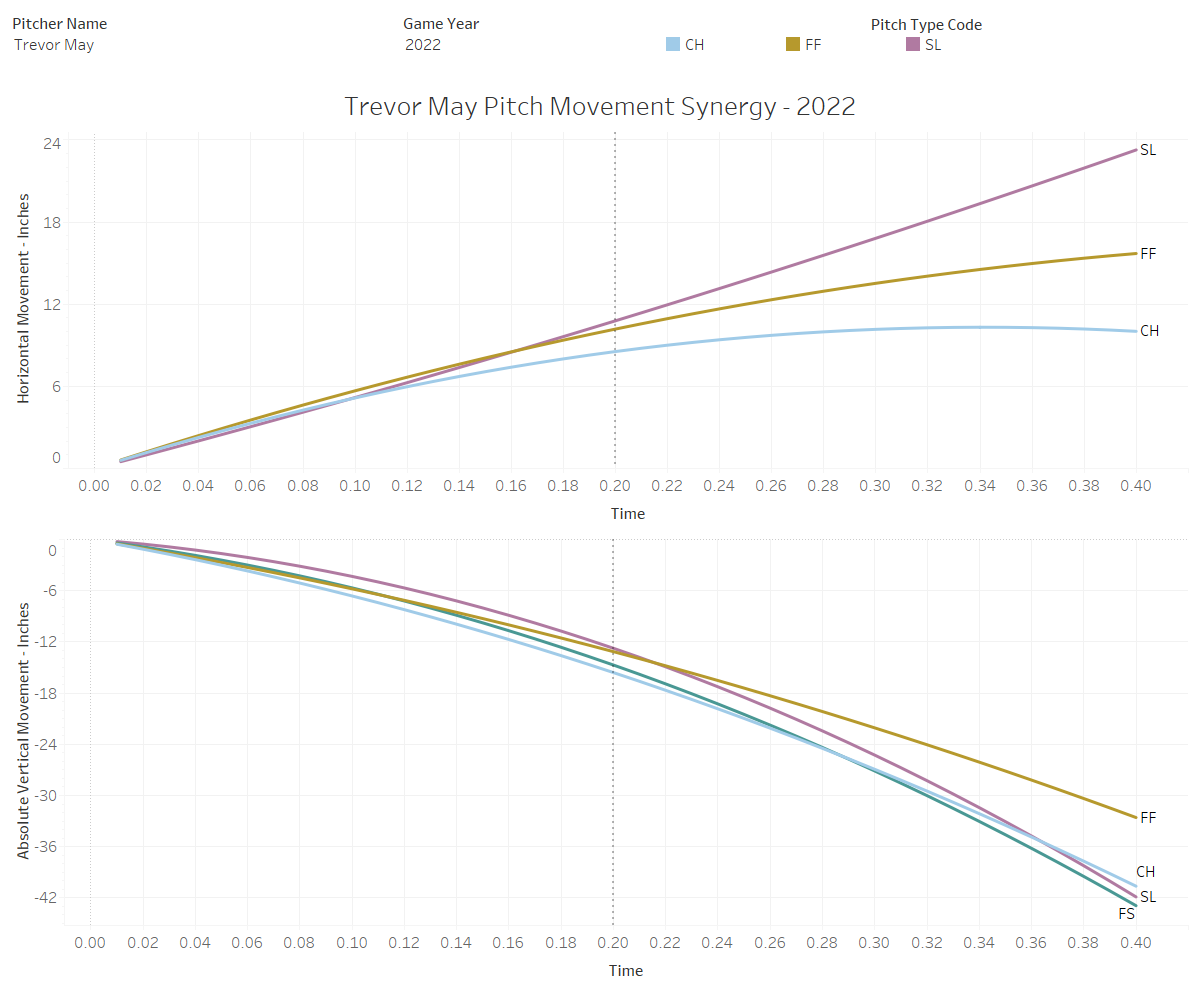
Trevor May
Trevor May changed his arsenal based on the recommendations in Rendon, Emery, et al. He details his process in this excellent video. Curious how that played out within this framework, I took a look at Trevor May early in the season, followed by September/October 2022. Clearly, the recommendations provided worked perfectly for Trevor, as we can see movement synergy that looks quite like deGrom’s on the horizontal plane.
Fantasy baseball side note: Pick up Trevor May. If healthy, he will be a dominant closer for the Athletics. The arsenal tweak is real and sustainable.
Trevor May Early Season:

Trevor May Late Season (Sep/Oct):
Evidence
Methodology
Step 1: Calculate a pitcher’s average four seam fastball movement (as described and depicted above) for each game. Pitchers make tweaks to their arsenal all the time (perhaps even in game), so it’s important to benchmark all of their pitches to the pitch as they are throwing it that day. I’m relying on Statcast pitch types for this.
Step 2: Compare all other pitch types to the benchmark fastball.
Step 3: Bucket all results into location buckets. Here I simply measure distance from the middle of the strike zone. Whenever dealing with movement, you are necessarily measuring location as well. If we merely look at chase rate and movement, less movement will garner more chases simply because they will, generally speaking, be closer to the zone. This should not be used to conclude that less movement is better. We wanted to be very careful that we didn’t accidentally measure location data when attempting to assess tunnels.
Step 4: Look at swing rates by location. In future work I’ll quantify the quality of swing decisions, however, the purpose of this piece is to establish a simple, powerful synergy framework.
Step 5: Choose an arbitrary point in time (in this case 0.14 seconds after the ball is 50 feet from home plate) to assess synergy. We could also compute the average deviation throughout the information zone, but this will work for the initial pass. I want to stress that 0.14 is not special in any way, and that the choice of this cut-off is arbitrary.
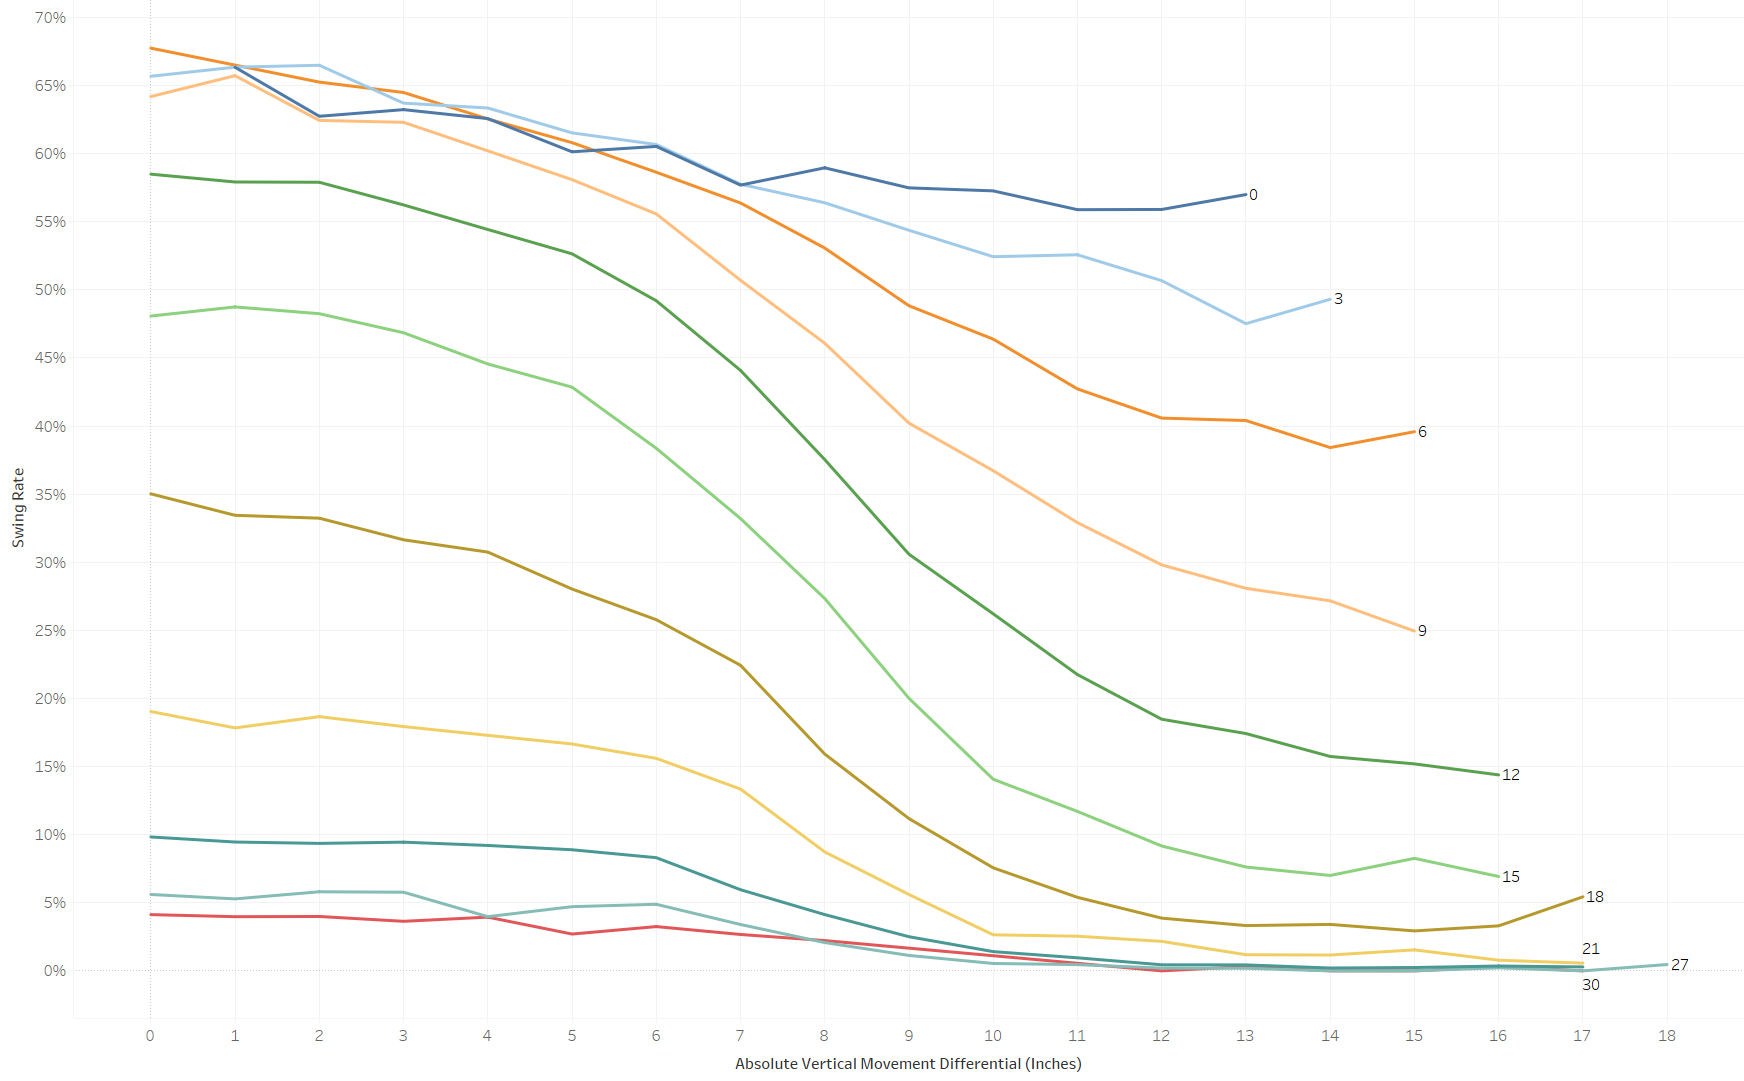
Swing Rates & Pitch Types at the 0.14 second mark after reaching 50 feet from home plate
Let’s begin with the curveball and horizontal separation.

Here we see swing rates bucketed by distance (each line is a distinct location bucket) from middle-middle in the zone (measured in inches). Note that swing rates are heavily dependent on location (other breaking news at 6). Let’s focus for a moment on the 15 inches from middle-middle bucket; pitches that have a lot of horizontal separation from the fastball will get swing rates in the low teens. Pitches with minimal horizontal separation (less than 5) can get upwards of 40% swings.
This implies two things: First, it can be an excellent tool to get batters to chase, even pitches 21 inches away from dead centre. Second, it can also freeze a batter, if the pitcher intentionally doesn’t synergize a pitch. This is the classic “drop in a curveball for a strike”. However, if the pitch is right down the middle (less than 6-7 inches from dead centre), swing rates will still be high.
The Curveball and vertical separation:
We see a similar story here, but there is perhaps less leeway. With horizontal differential there appears to be a slight swing inducement benefit within a small window, with vertical separation this starts reducing immediately.
I’m not going to analyze all the different pitch types in this piece, but will provide them here for reference:
Sliders:


Changeups:


Concluding Thoughts
I propose a simple, yet elegant, way of looking at pitch movement synergy: how different do the pitches look in terms of vertical and horizontal movement, throughout the information zone. Looking at pitch movement synergy from this lens is easy to compute, easy to visualize and provides intriguing insights. Pitchers should minimize the movement differential on both the horizontal and vertical plane throughout the information zone, while maximizing the differential at home plate.
Thank you to Tom Tango and Harry Pavlidis for their feedback and revisions to this piece. Revisions and feedback do not imply endorsement.
References:
Long, Pavlidis and Alonso – Updating Pitch Tunnels, BaseballProspectus (2018) https://www.baseballprospectus.com/news/article/37436/prospectus-feature-updating-pitch-tunnels/
Rendon, Emery, Sugar and Alexander – The Mystic Art of Pitch Tunneling, ProspectsLive (2022) https://www.prospectslive.com/prospects-live/2022/8/23/the-mystic-art-of-pitch-tunneling
Higuchi, Nagami, Nakata, et al. - Contribution of Visual Information about Ball Trajectory to Baseball Hitting Accuracy (2016) https://journals.plos.org/plosone/article?id=10.1371/journal.pone.0148498
Stadler, Mike – The Psychology of Baseball (2007)
May, How I went from L to W in 2022, YouTube (2022)
John Swearer, Visual Angle, Encyclopedia of Clinical Neuropsychology https://link.springer.com/referenceworkentry/10.1007/978-0-387-79948-3_1411#:~:text=Visual%20angle%20subunits%20are%20minutes,viewing%20distance%20(D0)
Fantastic analysis!
I have a few question about pitch movement synergy. First, can it explain why pitcher engage in designing "tight" slider?
Second, does pitch with tremendous movement like sweeper, slurve perform well in pitch synergy? If they can, does SSW helpful?
Awesome research!
Did you examine sinkers and breaking/offspeed pitches - the conclusion should be the same?
Curious, where did you get data for horizonal, vertical movement for pitches based on time, like hmovement at .20 seconds?